

 ع



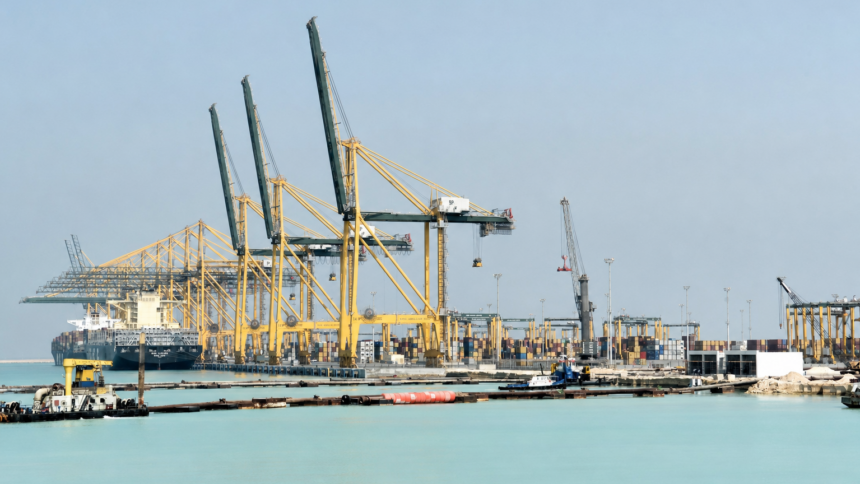
The General Authority for Statistics bulletin on international trade in goods for August 2026 placed the rise in national non-oil exports, which exclude re-exports, at 8.5 percent compared with the same month in 2025. Non-oil exports that include re-exports contracted 9.1 percent over the period while re-exports alone dropped 34 percent, according to the authority. The authority noted that the re-exports decline was driven by a 63.6 percent decrease in machinery, electrical equipment and parts thereof, a segment that accounted for 31.7 percent of total re-exports.
Plastics, rubber and their articles ranked as the leading non-oil export category with a 22.6 percent share of the total and a 7.5 percent increase from August 2025, GASTAT figures show. Chemical products and allied industries followed at 20.9 percent of non-oil exports but posted a 17.7 percent decline year on year. The authority’s data placed the ratio of non-oil exports including re-exports to imports at 36.51 percent in August, a slight rise from 36.48 percent a year earlier.
Merchandise exports overall fell 11.5 percent in August 2026 from the prior year while oil exports decreased 12.5 percent, the General Authority for Statistics reported. Imports declined 9.1 percent in the same comparison, a development that contributed to the recorded contraction in the trade surplus. The authority’s monthly bulletin draws on administrative records from the Zakat, Tax and Customs Authority together with oil export data from the Ministry of Energy.
On the import side, machinery, electrical equipment and parts represented 26.2 percent of the total and registered a 19.8 percent decrease compared with August 2025, according to the statistics authority. Chemical products and allied industries accounted for 9.6 percent of imports and rose 2.7 percent over the period. The authority applies the Harmonized System developed by the World Customs Organization to classify all goods in the report.
Successive releases from the General Authority for Statistics have tracked movements in these trade categories as Saudi Arabia pursues broader economic diversification objectives. The August figures follow patterns observed in prior monthly bulletins that similarly highlighted shifts between domestic production, re-exports and commodity-specific performance. The authority publishes the international trade in goods report each month with year-on-year and category breakdowns to support analysis of external sector developments.